|
Volume
114
|
Number
3
|
May-June 2009
|

|
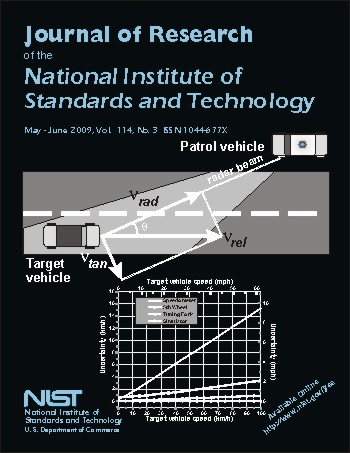
Cover Explanation:
Image shows the radial and tangential components (Vrad and Vtan ) of the relative velocity. This diagram is not drawn to scale; typical values for "lc theta" (greek symbol) are on the order of a few degrees for normal DTR radar operation. Also shown is the uncertainty for each calibration technique for a 99.73 % confidence interval (3 "lc sigma" (greek symbol)). See the paper by Jendzurski and Paulter of this issue for more information. Cover arranged by C. Carey.
<< Return to the Table of Contents
NIST
Journal of Research Home Page
